Orión Statistic Dashboard
Introducing our latest digital transformation project! Our company has revolutionized the way businesses generate statistical reports and dashboards by automating the entire process. Using cutting-edge statistical functions, our system is able to generate real-time statistical reports and dashboards directly from market research data, all within a user-friendly web interface.
Project Name : Digital Transformation Process
Client : B&Optimos
Project Commencement Date : September 20, 2018
Project Completion Date : September 20, 2019
In today’s data-driven business landscape, generating statistical reports and dashboards is essential for making informed business decisions. However, manually generating these reports can be a time-consuming and error-prone process. That’s where our Statistic Dashboard comes in – a cutting-edge digital transformation project that automates the entire process of generating statistical reports and dashboards from market research data.
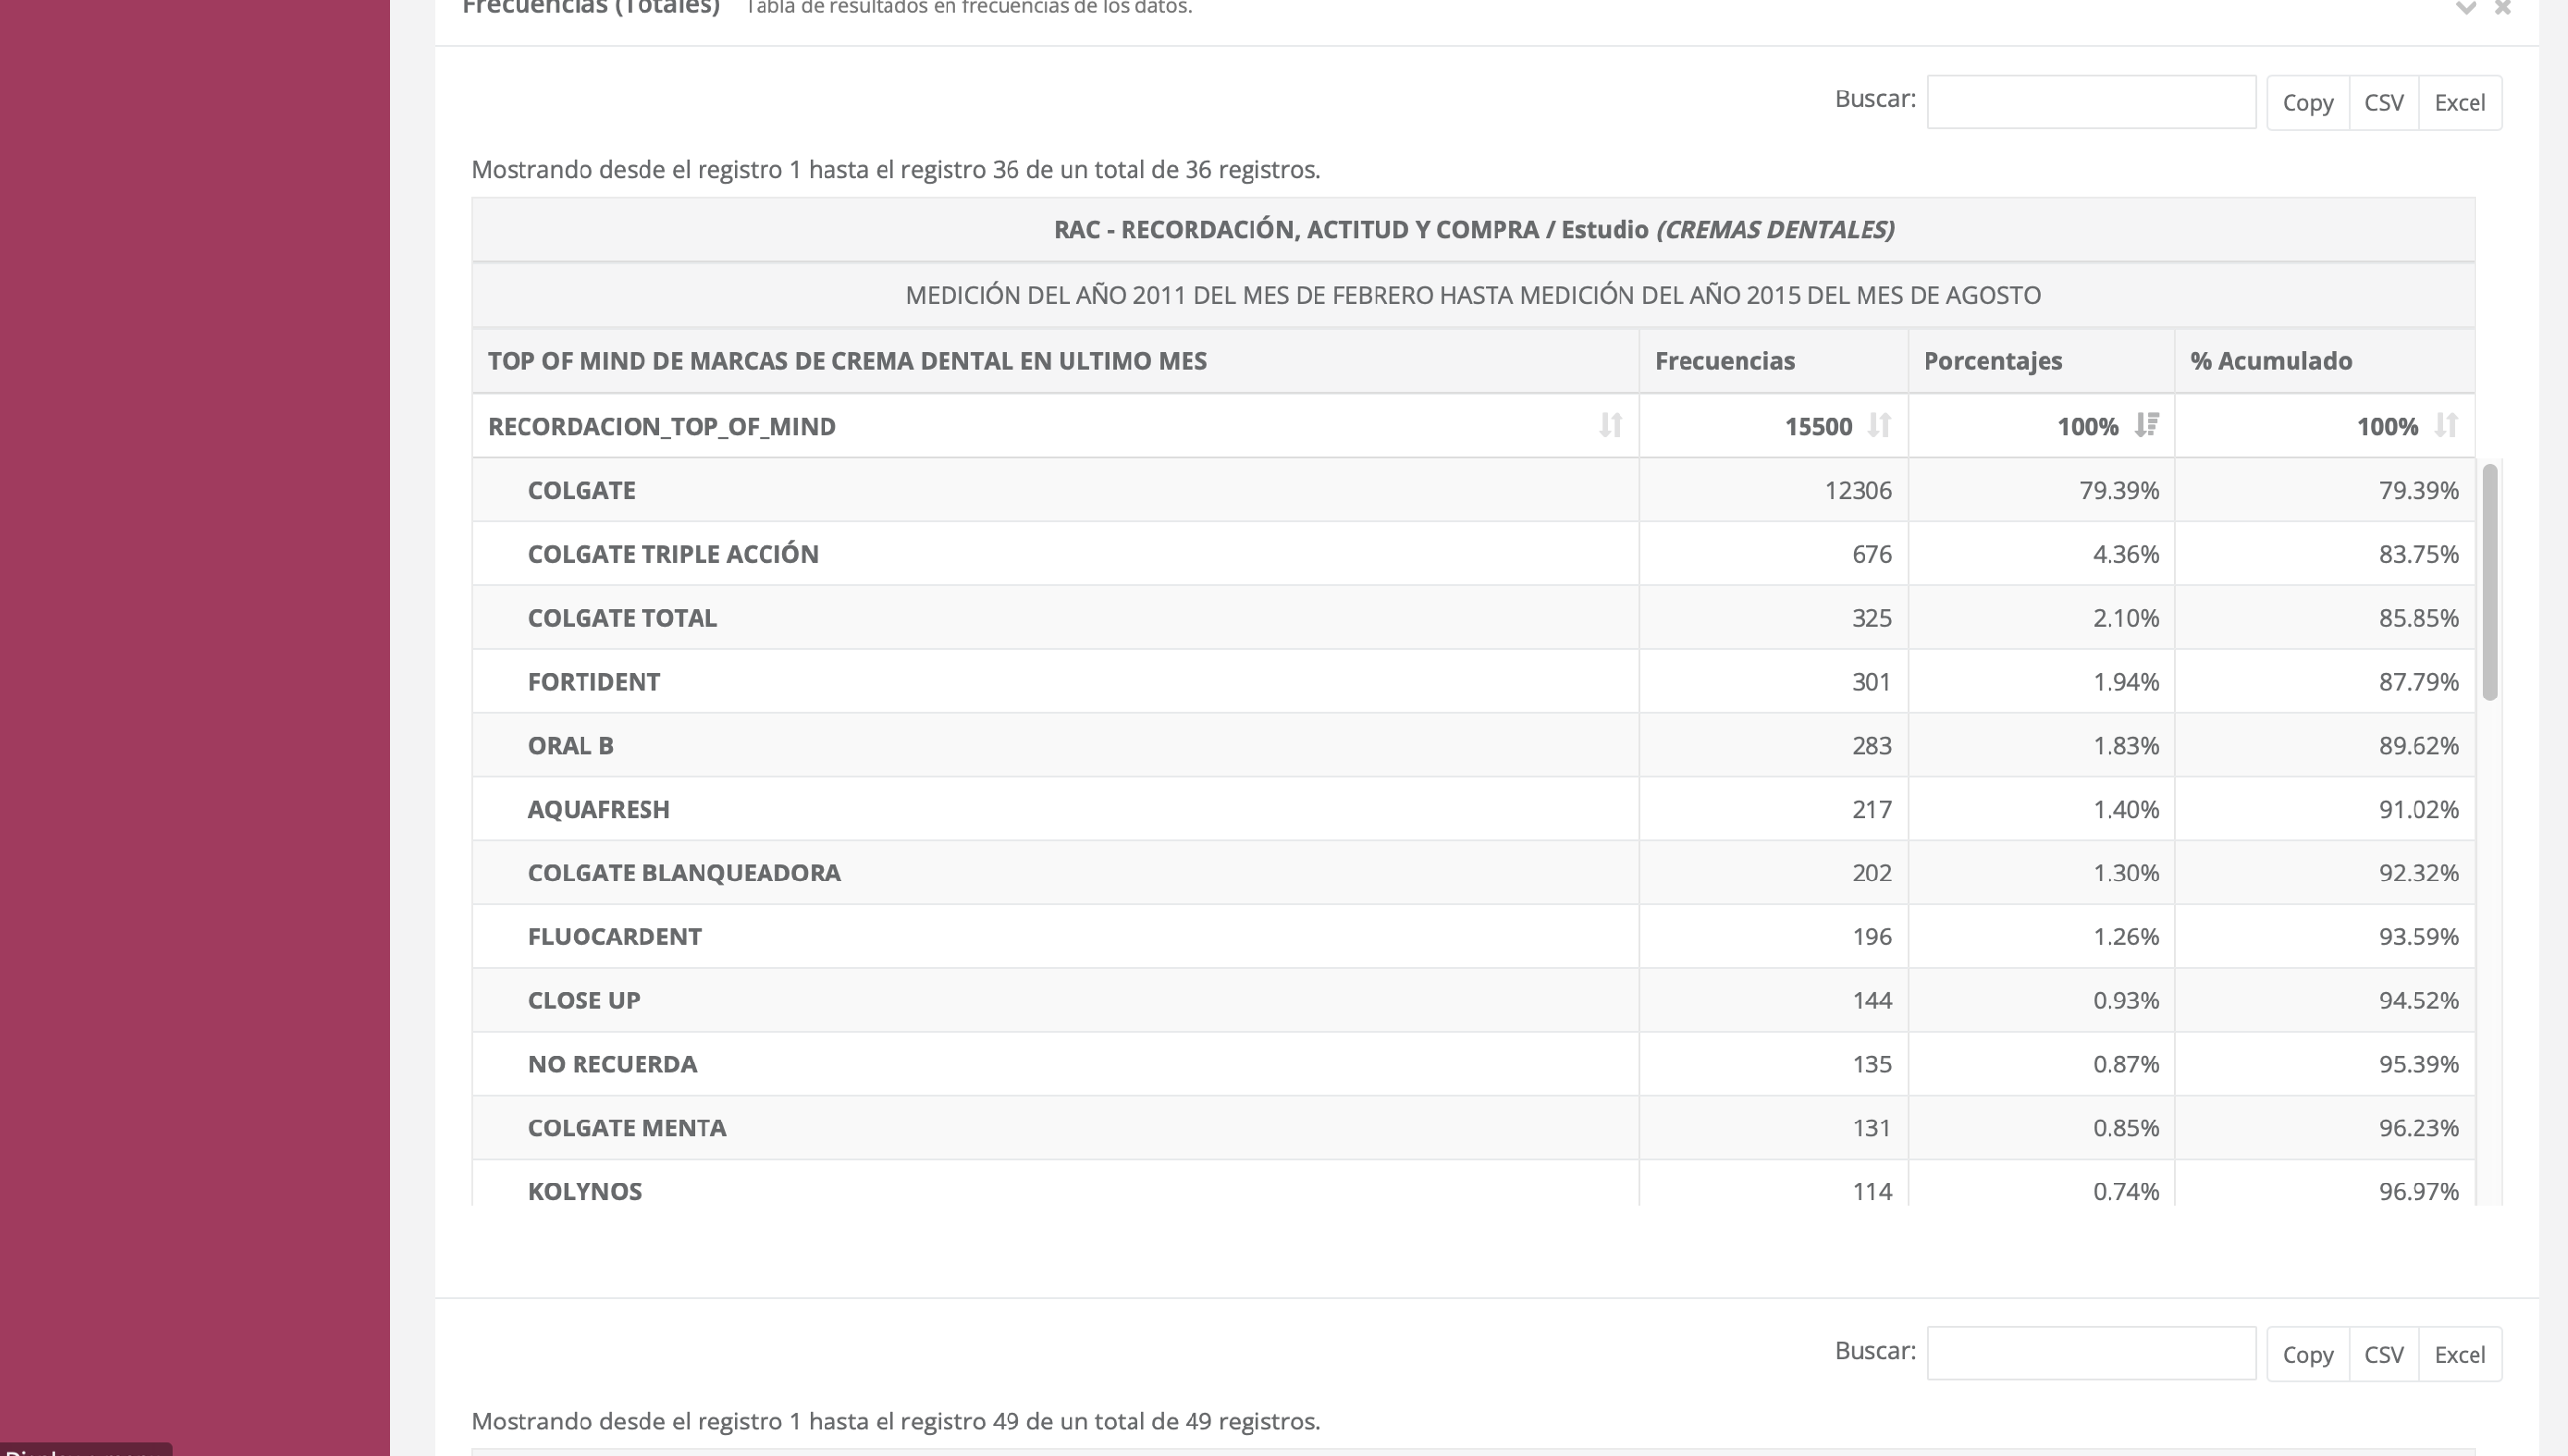
One of the key benefits of our Statistic Dashboard is its ability to automate the process of generating statistical data. Before our system was implemented, businesses had to use software like Gandia Barbwin and SPSS to generate statistical data, which could be a time-consuming and complex process. With our system, businesses can generate statistical data in real-time, directly from their market research data, eliminating the need for complex software and streamlining the entire process.
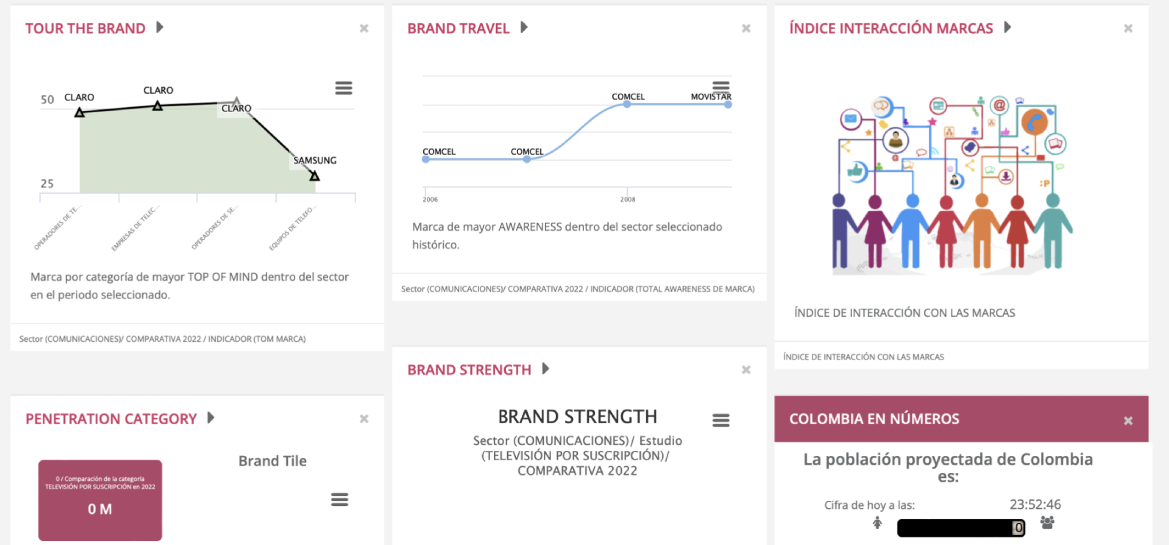
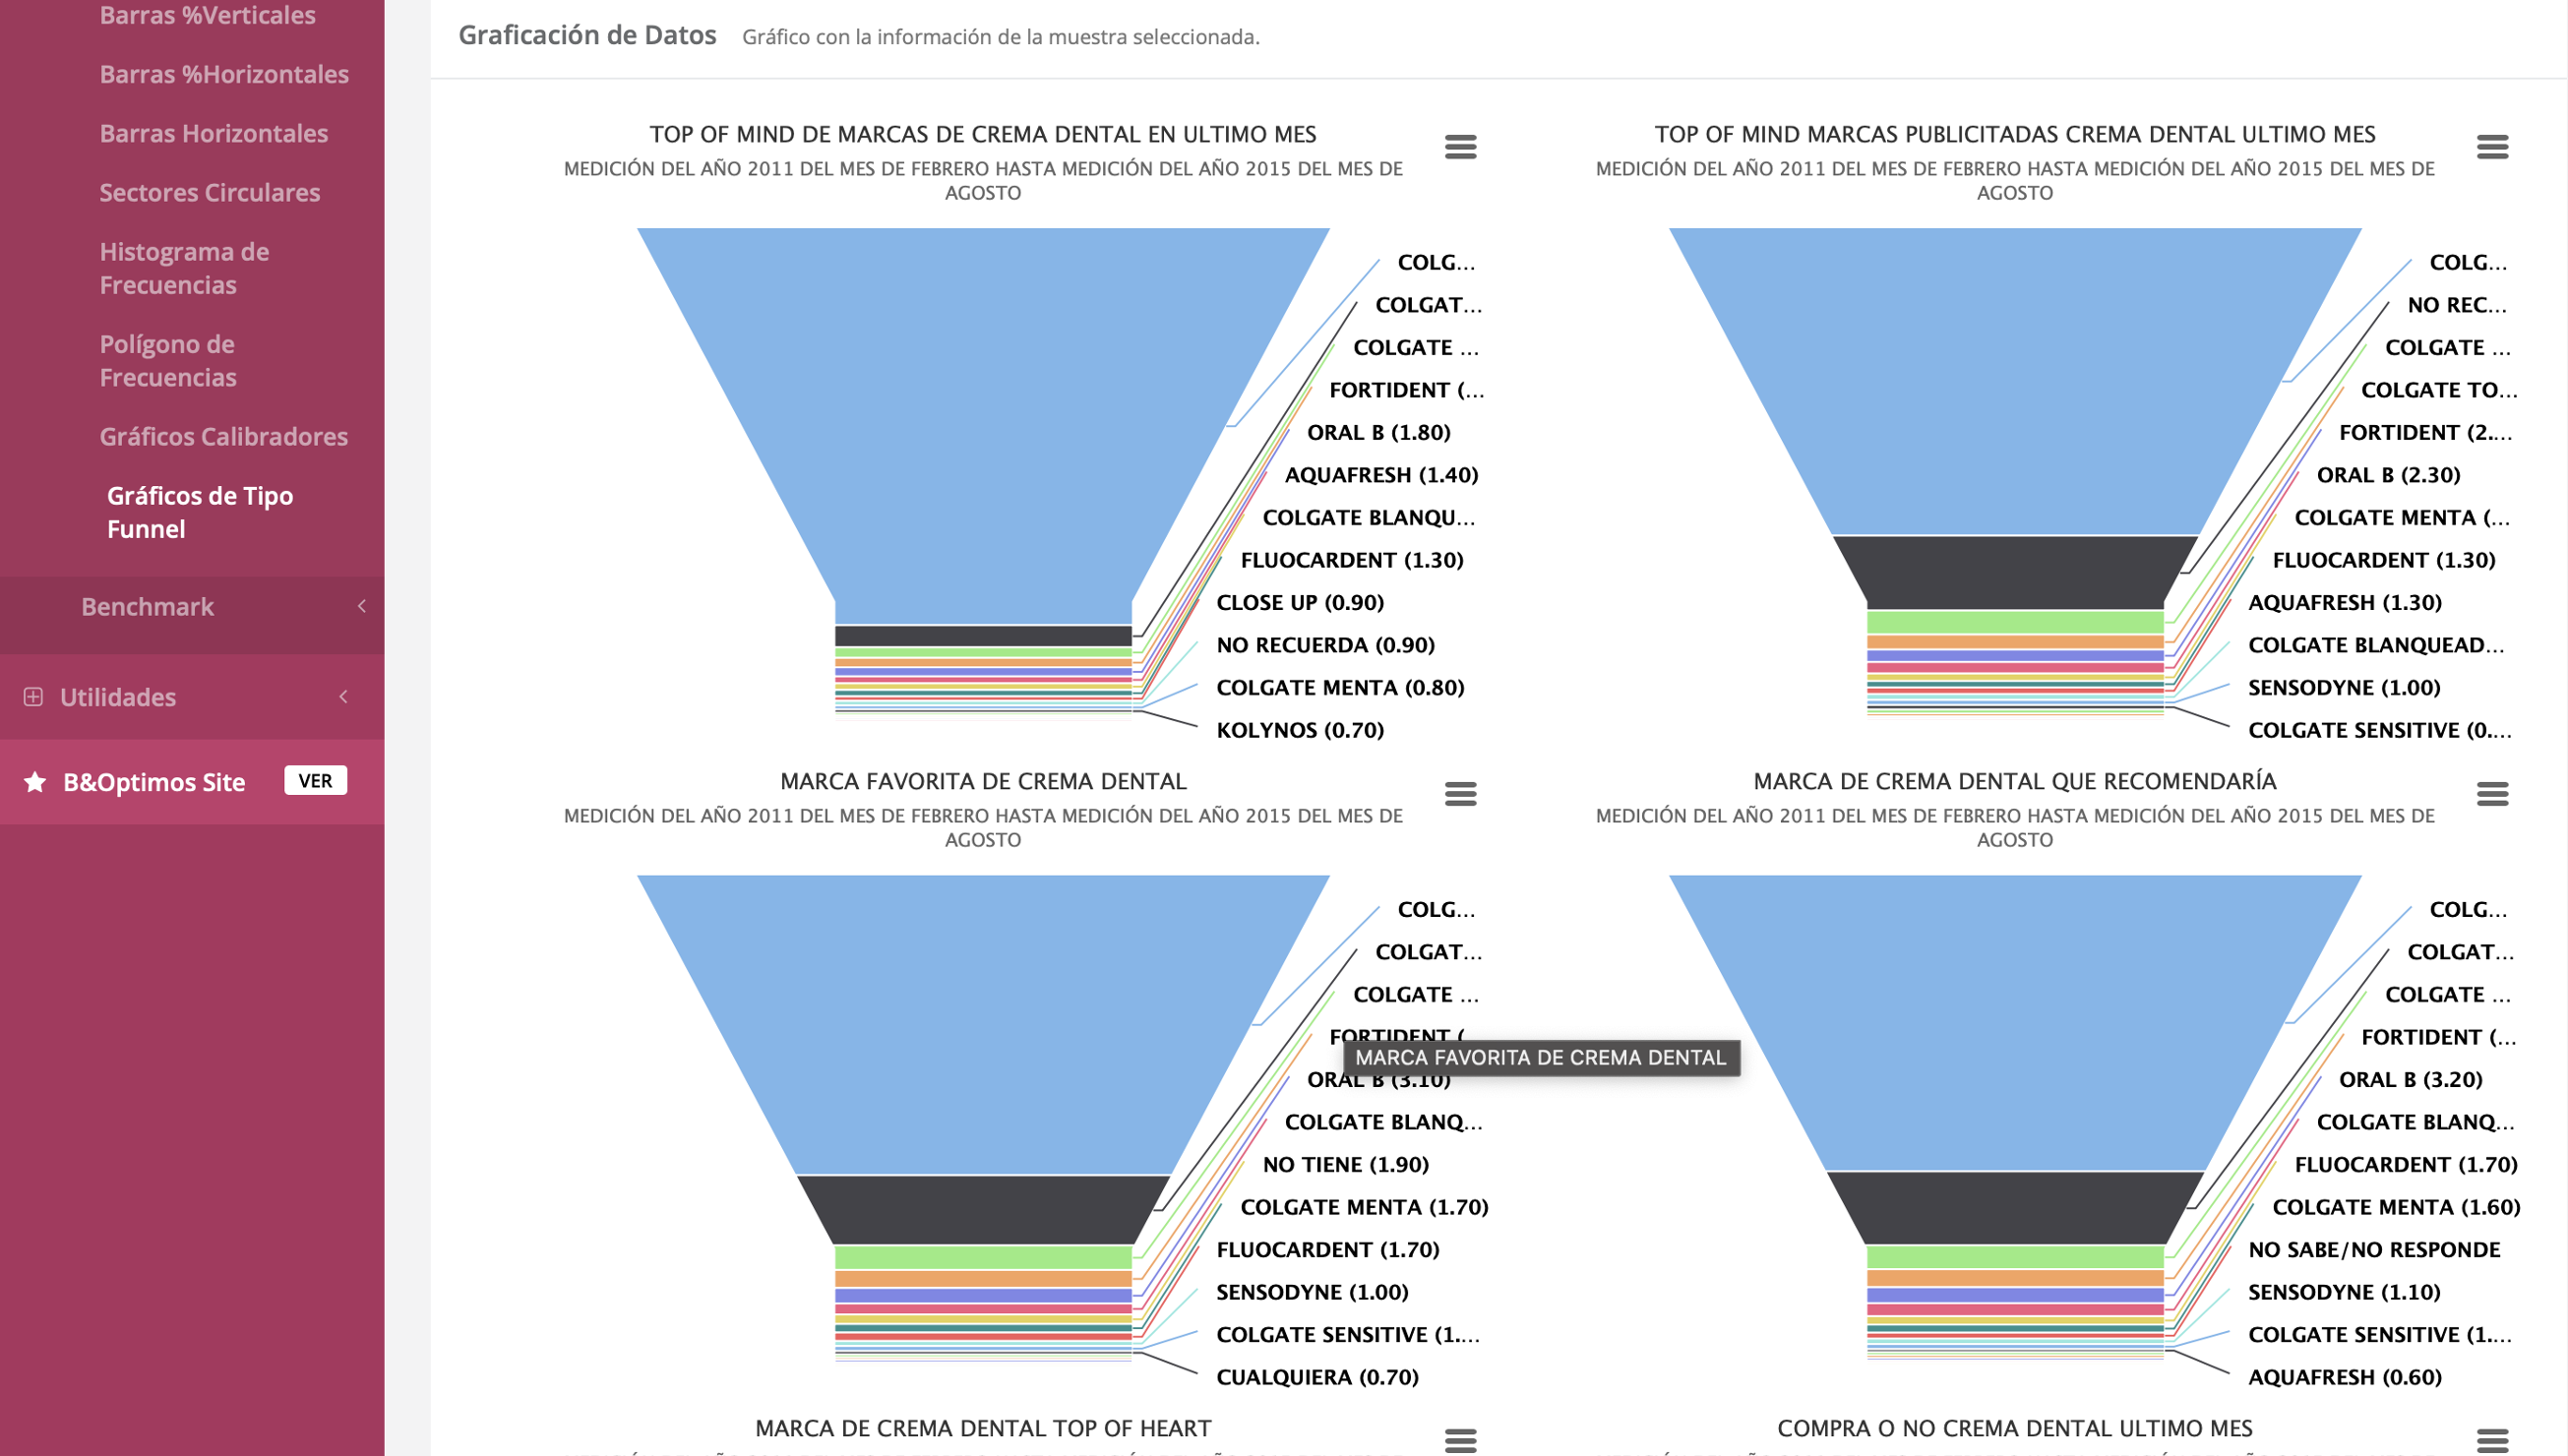
Another important feature of our Statistic Dashboard is its ability to automate the process of generating graphical data reports. Before our system was implemented, businesses had to manually generate these reports using tools like PowerPoint. With our system, businesses can generate graphical data reports automatically, saving valuable time and resources.
In addition to automating the process of generating statistical and graphical data, our Statistic Dashboard also automates the process of uploading and transforming data from interviews. Before our system was implemented, businesses had to manually review and integrate data using Excel. With our system, businesses can upload and transform data automatically, streamlining the entire process and reducing the risk of errors.
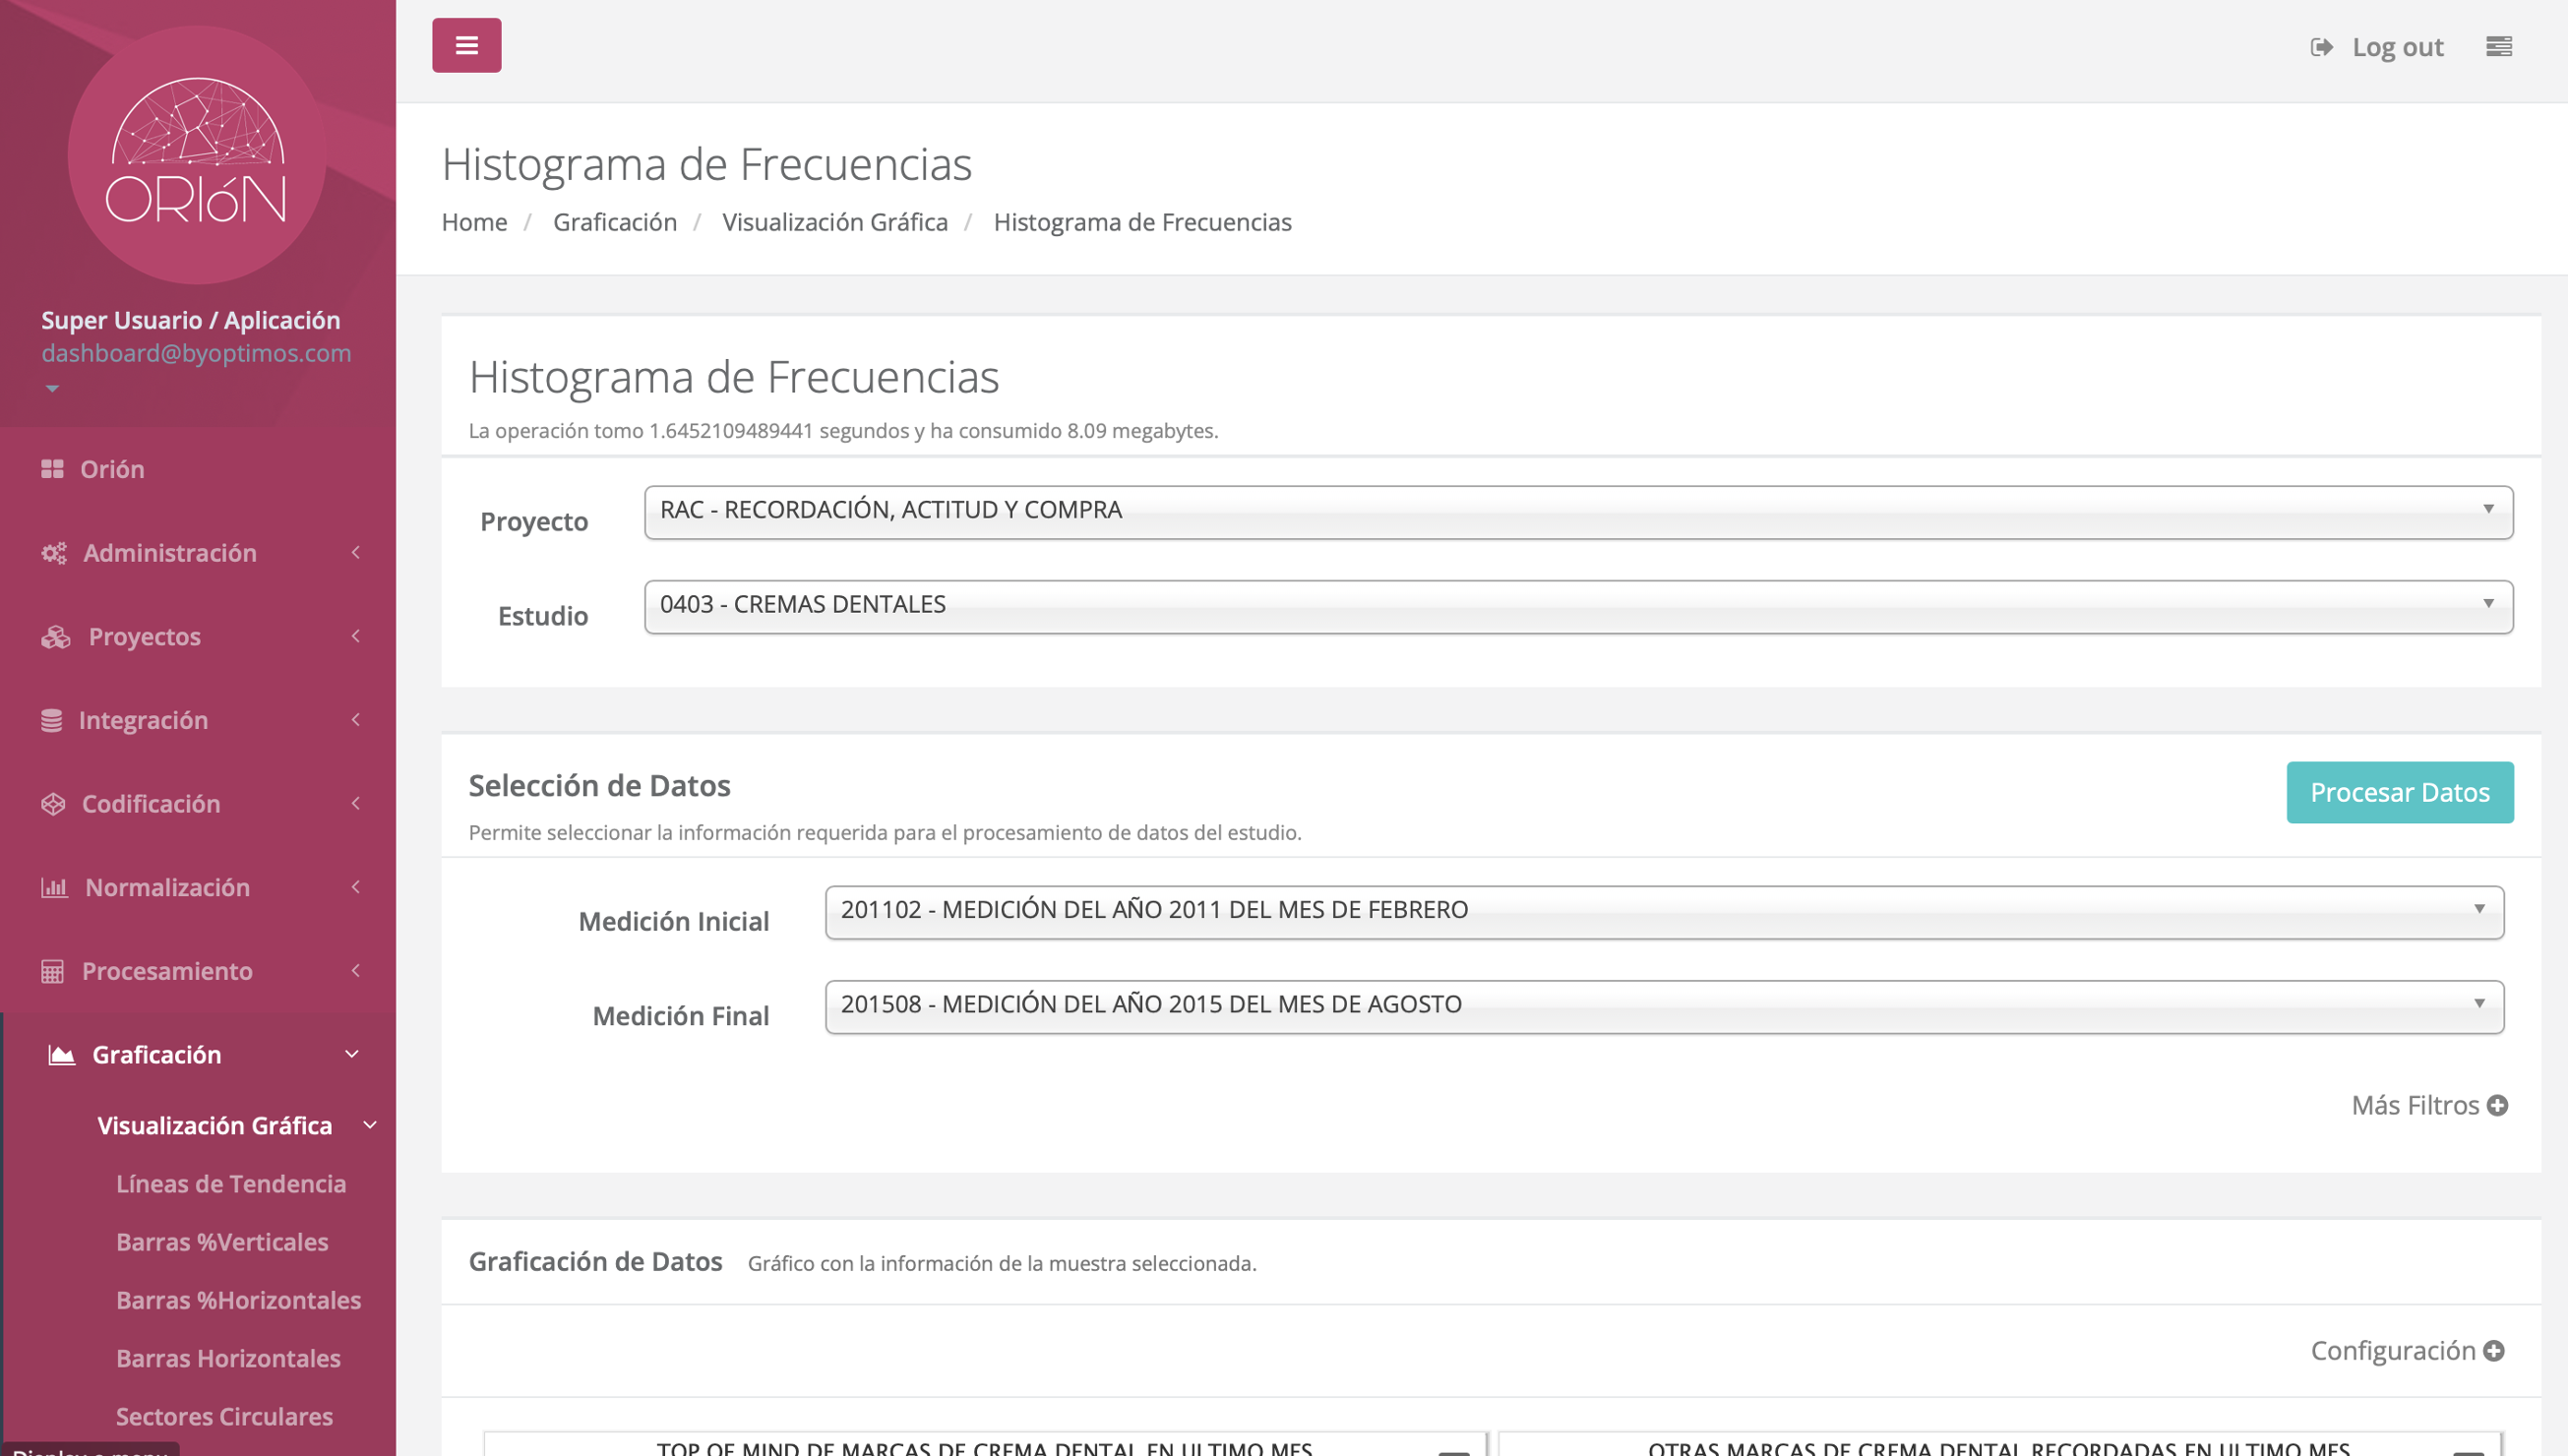
Our Statistic Dashboard also includes specialized statistical calculations that are automatically performed in real-time. This feature allows businesses to quickly and easily generate valuable insights into their market research data, providing them with the information they need to make informed business decisions.
Finally, our Statistic Dashboard includes an automated coding process that transforms text into codes. Before our system was implemented, this was a manual process that could be time-consuming and error-prone. With our system, this process is automated, saving businesses valuable time and resources.
At our software development company, we pride ourselves on our ability to deliver cutting-edge digital transformation projects like the Statistic Dashboard. Our team of experts has the skills and abilities needed to implement complex systems that automate manual processes and streamline business operations. With our Statistic Dashboard, businesses can generate statistical reports and dashboards quickly and easily, saving them time and resources and providing them with valuable insights into their market research data.